
Reading the article by Dr. Amir ( "Hasadeh" 77, December 1996, in Hebrew) one gets the impression that the wheat grain yield is reduced when there are excess levels of soil P. This Reduction of grain yield reduction in semi arid regions is common when high soil P encourages vegetative growth and the production of many tillers early in the season. It is very common in rain fed wheat areas that a shortage of water develop at the grain filling time. Under these conditions, the flush vegetative growth at the beginning of the seasons caused by excess soil P will lead to a severe water shortage during the grain filling period. Such a case leads to the failure to reach the potential grain production, to a change in the ratio of straw to grains and to a reduction in the percentage of grains in the overall dry matter (drawing 2.12 from Amir's work). Irrigation just before grain filling stage greatly improves grain yield (Shimshi, D. and U.Kafkafi , The effect of supplemental irrigation and nitrogen fertilization on wheat (Triticum aestivum L.). Irrigation Science 1:27-38 (1978).
Corn grain yield as a function of "available soil phosphorous" (extracted by Bray I method) Is shown in  Fig. 2.01 , (data from the United States). It appears that above a particular threshold, of about 10 ppm of Soil P there is no additional grain yield.
A linear grain yield response to phosphorous up to a certain soil P value, and subsequently ceasing with the increase in soil P is usually observed.
The response to increasing levels of nitrogen can be usually described by a quadratic response function with a maximum point beyond which additional nitrogen results in lower grain yields
This is not the case with the reaction to phosphorous. Usually a large increase in fertilizer P does not lead to yield reduction, but an asymptotic response curve is obtained. Nitrogen excesses cause a decrease in grain yield as a result of symptoms similar to those observed in P shortage. When high doses of nitrogen fertilizer are given, the concentration of nitrate in the solution rises.
The nitrate uptake increase the pH at the root surface. The high pH interferes with the absorption of phosphorous. by the plant due to the increase in the proportion of the divalent phosphate HPO4- (  Fig.2.16) in the solution near the root. Adding fertilizer P can overcome this hurdle and make a further yield increase possible. Wheat grain yield at the combination of 1200 kg/ha of ammonium sulfate fertilizer was lower than at half the N level at the low and the three highest levels of fertilizer P (results from the permanent fertilization plots at Bet Dagan) this is a clear interaction between P and N .(Fig 2.02, Kafkafi, 1974)
At the highest level of N (240 kg N/ha) the mount of P uptake by the plant is dependent on soil P and plant development. The highest the soil P the highest is the P uptake. The peak in P uptake correspond to spike appearance which is early almost by 2 weeks by the high P treatment. (Fig. 2.03)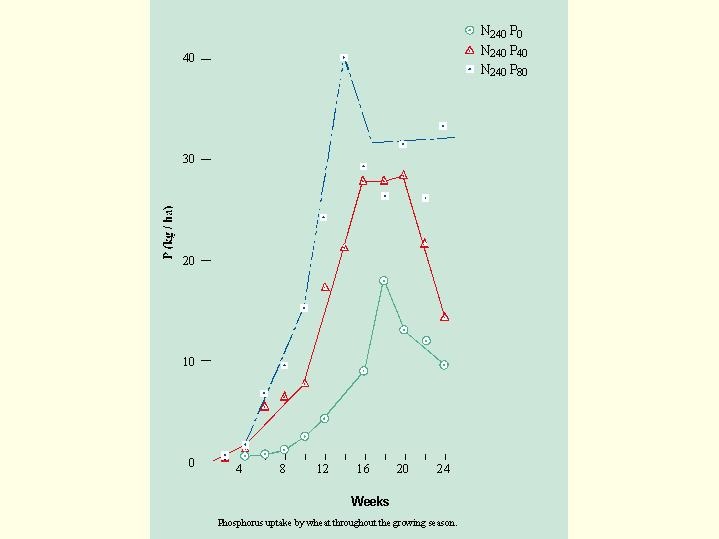 . The late loss of P in the plant is due to leaf loss.
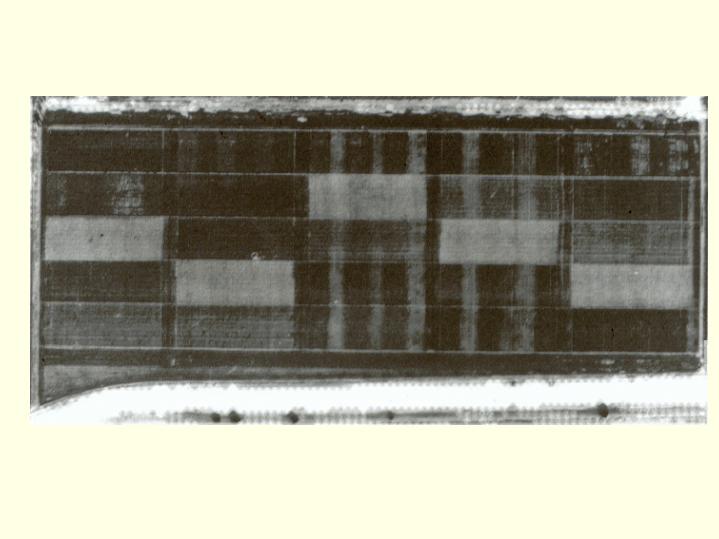
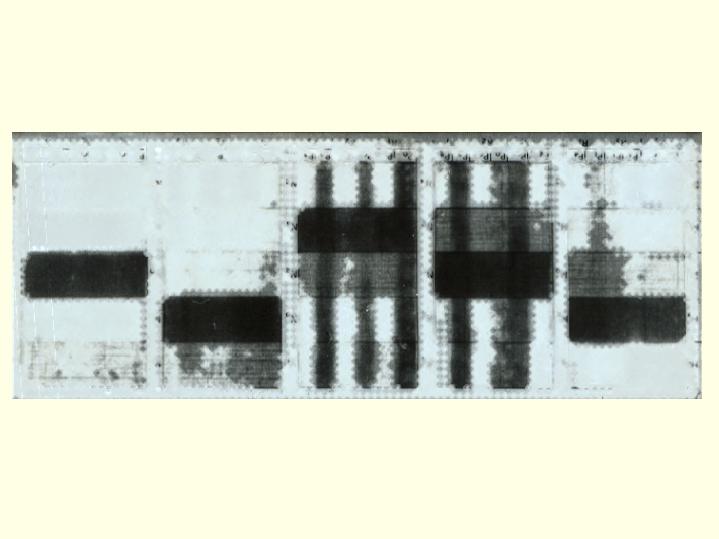
In an infra-red aerial photograph of the wheat (photograph 2.04) (the permanent fertilization plots at Bet Dagan in 1969), it is possible to distinguish clearly between the treatments. Low P plots are vary dark (perpendicular direction in the photograph and low N plots are horizontal dark in the picture. The dark areas in the infra red film demonstrate the heat reflected from the soil. When the soil is exposed the plant development was hindered and part of the soil is not covered by leaves as shown in Fig. 2.06). Increasing the nutrient levels increased plant growth , and the part of barren soil is reduced as a function of N and P fertilization.

The residual influence of organic fertilizer differs with the treatments: in plots without phosphorous, the residual organic manure nitrogen is not effective. On the other hand, the phosphorous in the manure has a clear residual influence . In the photographs R1 represent only mineral fertilizers R2 represent Farm yard manure + mineral fertilizers.
The aerial photograph taken by regular visible light film (photograph 2.05) shows white spots in high P plots. This is reflected flash from the large broad wheat leaves which are bent and reflect light as shown by the ground photograph taken at the same time of the aerial picture.
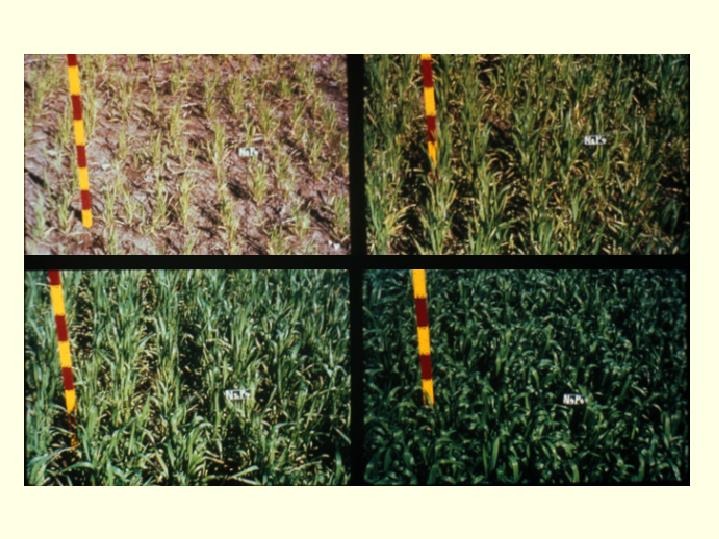
In a close-up picture taken in February it can be seen that the low soil P (photograph 2.06 ) delays wheat growth. Adding N on low P plots was not very effective. On the other hand on high P plots, addition of N creates a clear growth response (photograph 2.07). 
The crop potential, accordingly, is clearly increased when both phosphorous and nitrogen are added. If the wheat is designated for silage or is irrigated - it is quite clear that the increased fertilization serves a purpose. In the case of wheat growth for grain - the optimal fertilization depends on the quantity and distribution of the rains. If there is no phosphorous - the branching out is disturbed, whereas if there is a lack of nitrogen, growth is retarded. The higher the soil P level- the higher is the dry matter production. This is not necessarily the case with the grain yield.
In a photographs taken in April the same year (photograph 2.07a), it is clearly seen that in the high P- treatments many spikes as well as broad leaves are present. 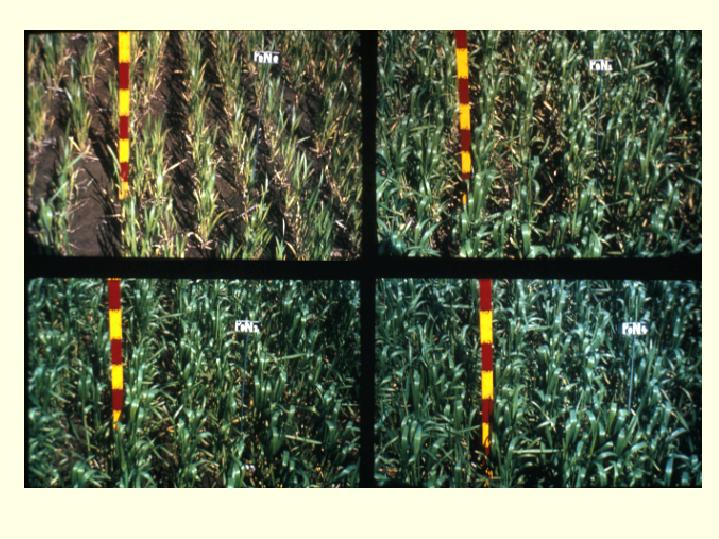
A cessation of rain and lack of water under these circumstances lead to a serious drying up of grains. Accordingly, with the very high levels of soil P in the Bet Dagan experiment - the grain yield was low at the high P high N combinations (Fig 2.02!!!!! should be corrected). The number of grains increased, their harvest day came earlier, but the total grain yield was low, because earlier usage of water by the excessive vegetation left no available water at grain filling time.
Total K uptake (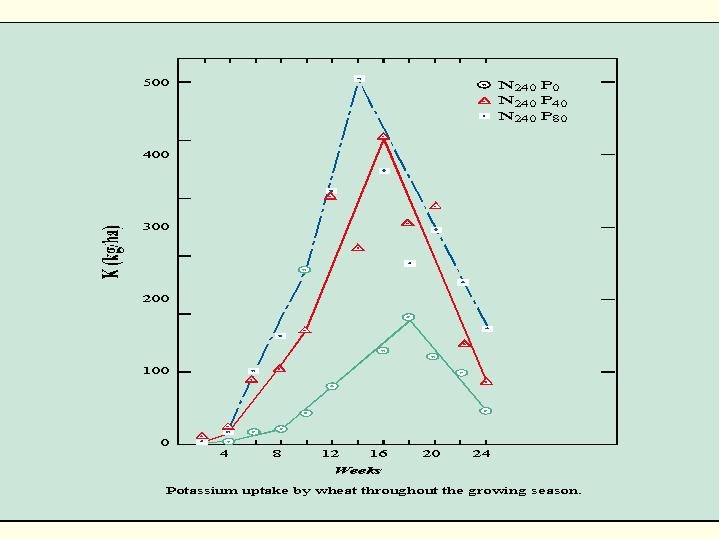 Fig. 2.08) with the same treatments as of Fig 2.03 demonstrate that at "grain milk stage" the wheat plant contain 500 kg K per hectare, whereas at low P, about 160 kg K/hectare only. Later, during grain filling period, from week 14 onward, most of the K leaves the plant and return to the soil. This pattern of K in wheat plant has an important implication to K demand by the successive crop after wheat. In the case when wheat is harvested green for silage, close to the "grain milk stage" large quantities of potassium are removed from the soil. If a summer crop like corn or cotton follows the wheat harvest, no time is available to recharge the soil with exchangeable K and K deficiency might develop in the succeeding crop. Therefore K fertilizer must be given to the wheat for silage in double cropping system, or an attempt must be made to complete giving the potassium fertilization before sowing the next crop (cotton, maize).
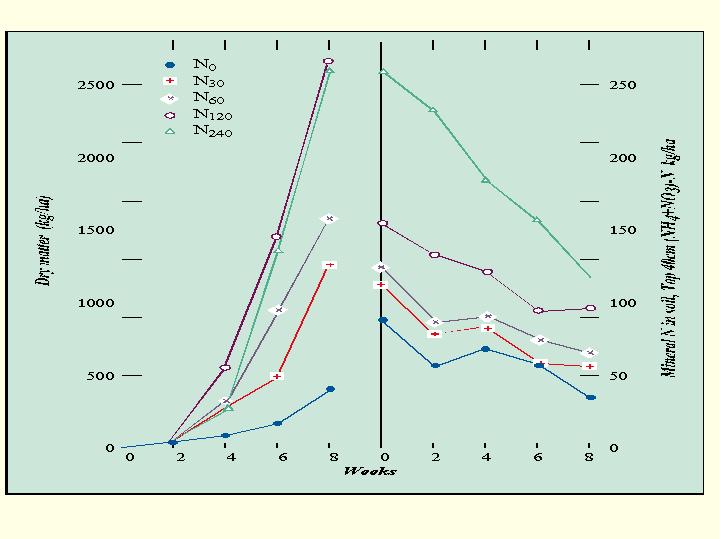
Nitrogen in plants (  Fig. 2.09) suggest that at the high fertilization levels the wheat took up over 10 weeks period, (between the 4 th and the 14 th weeks) about 30 kg N/ha each week.
The high nitrogen treatments (  Fig. 2.10) delayed plant growth until week 4 by reducing P uptake . This occur when the soil mineral N level was above 180 kg N/ha in the upper 40 cm soil layer.
There is therefore no reason to fertilize wheat with high N dose a basal dressing. It is preferable to provide top dressing after about the first 6 weeks of wheat growth. An excessive basal dressing could also damage the crop at the beginning of the season, because of its influence on the delay in P uptake. Similar results were high soil nitrate content reduce P uptake were recorded with maize as well (Bar-Yosef, B. and Kafkafi, U. (1972). Rates of growth and nutrient uptake of irrigated corn as affected by N and P fertilization. Soil Sci. Soc. Am. Proc. 36:931-936.).
Phosphorous fertilization ensures greater exploitation of the nitrogen from the depth of the root zone and prevents its leakage to ground water. This nitrogen, which is absorbed in the plants, is transferred during ripening to the seeds and contributes to the crop and to the concentration of protein in them. In the actual wheat yield a lack of water or an imbalance of N:P limit the benefit of nitrogen fertilizer.
In  Fig. 2.11 the depletion of soil nitrate is shown for the 5 nitrogen levels applied. By the 12 th week nitrate is almost totally removed from the soil. Afterwards there is a slight recovery in the nitrate concentration in the 0-40 cm soil layer suggesting that soil N is nitrified and accumulated but is not taken up by the plant at these final growing stage.
A graph which Yaakov Amir did not include in his article in "Hasadeh" (  Fig. 2.12), shows the results of the "P index test" - the amount of P taken up by maize (Gilat method) from 0 to about 600 mg./plant - against actual grain yield obtained in the field. The total plant dry mater increases almost linearly with the increase of the P content of the test plants, up to about 400 mg P/plant, whereas with the grain yield stop to respond at about the 150 mg P/plant .
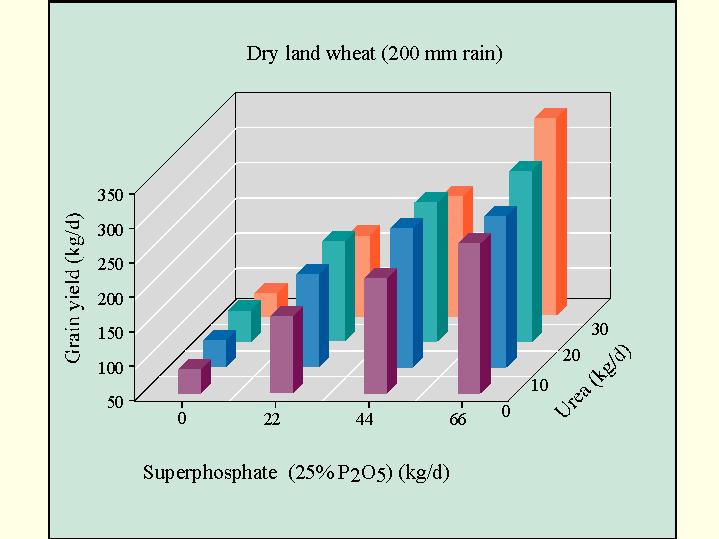
The limiting factor, the lack of water, prevented a further increase in grain yield. Therefore, in the view of Dr. Amir, there is no purpose in phosphorous fertilization beyond this level, in the Negev region with its low precipitation, as an increased straw yield will be obtained without increase in grain yield. In the wheat experiment at Nachal Oz in 1988-89 as well (Gil Nir and Ofer Shiffer,  Fig. 2.13 ) without phosphorous fertilization there was no response to nitrogen in the dry mater yield. With the additional 440 kg superphosphate/ha a response to N was obtained and it increased when the phosphorous was given in an amount of 660 kg superphosphate/ha . There was also an interaction of N x P in the grain yield.
Even without the addition of nitrogen there was a response in the grain yield to the addition of P. The phosphorous content in the dry material on 22.2.89 increased to 10 kg/ha P when the phosphorous fertilizer was increased ( Fig. 2.14). The influence on the grain yield depends on whether the limiting growth factor is P, N or water.
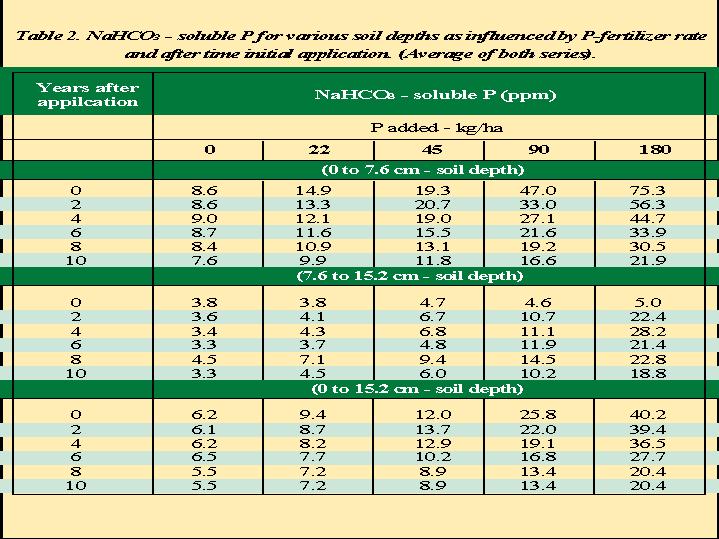
A table (Black, Agronomy Journal 74 ) ( Fig. 2.15) is showing the bicarbonate extractable P (Olsen's method) at various soil depths and at long periods of time (0, 2, 4, 6, 8 and 10 years) after fertilization with varying doses of phosphorous: 0, 22, 45, 90, 180 kg P per hectare. It is clear that the majority of the added P is recovered in the top 0-7.5 cm. Unfertilized soil maintained a fairly steady P value during the 10 years,.
Immediately after the addition of the fertilizer to the top layer the extractable P(at time 0) increased accordingly.
With time the fraction of P that is extracted by bicarbonate is reduced. The extraction efficiency of the bicarbonate extract decreases as the reaction time of P with the soil increases. In the high P levels, movement of P to a lower depth was also found ( Fig. 2.15), and again there is a subsequent fading in the concentration of P tested with the Olsen method.
The plant may extract P that is not extracted by the bicarbonate if the pH is changed near the root surface. When the root acidifies its environment - it may dissolve soil P not extracted by the bicarbonate solution. There are very many methods for extracting soil phosphorous. It has long time since it have been observed that roots can release citric acid . It was suggested over a century ago that diluted citric acid be used as a test for available phosphorous (Dyer). (The phosphate industry, uses citric acid to characterise the solubility of phosphate rock.).
There are numerous methods for estimating "available soil P" e.g. sulfuric acid, ammonium lactate, ammonium fluoride and many more. Only in 1959 was the Olsen method adopted. This method was more successful from the point of view of correlation to the yields obtained. The main problem is that 5 grams of soil represent a field. Therefore a uniform sampling is essential and even that does not ensure a precise representation of a field. Preparation of the sample is critical. Even the conditions under which the sample is shaken (temperature, speed and direction of the movement etc.) have a great influence on the result. Accordingly - there is no significance for differences of 2 - 3 ppm P.
The various solutions used to extract soil P - and there are many - extract a different fraction of soil P and give a different correlation with yield obtained in various soils.
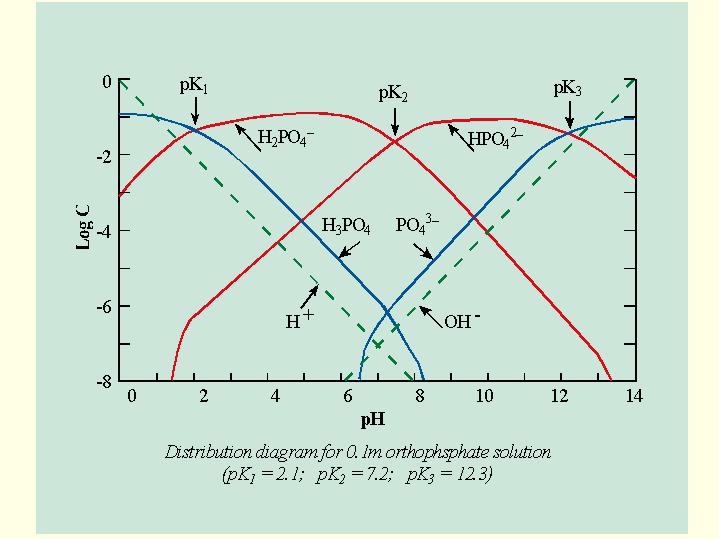
A diagram representing the log C of P dependence on pH (  Fig.2.16) shows that the concentration of non-ionized phosphoric acid drops from log C = 0 to log C = -8, between pH = O and pH 8, Phosphate ions are governed by the pH. In the region of pH = 4 to pH = 8, which prevails in most agricultural soils, there are present mainly H2P04- and HP04 2- win the solution. The pK2 of the acid (which is defined as the pH in which equal concentrations of H2P04- and HP04 2- ) is 7.2 . At pH 8.2 HP04 2- already constitutes 90% of all the P species in the solution. A very small change in the pH therefore brings about a marked change in the type of phosphate ion in the solution.
Changes in pH occur in the plant root zone according to the type of nitrogen species available. Only H2P04- is taken up by the plant. The ion HP04 2- is not absorbed by he roots.
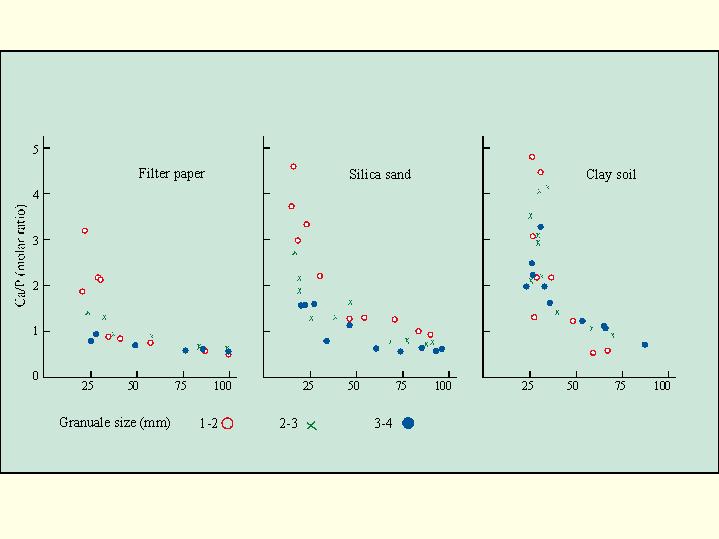
In the M.Sc. thesis by Aviva Hadas, published in "Ketavim" 7(a) 1966 it can be seen ( Fig. 2.17) that about half the phosphorous in the superphosphate granules leaves it for the solution, when it is inducted into moist soil, and the balance remains as an apatite in the granule .The molar ratio of Ca/P in the remaining non soluble fraction rises quickly. During washing the granule with distilled water on filter paper - 25% of the phosphorous remains as apatite in the granule.
The pH of the solution that leaves the granules approximately 1.5, and it contains phosphoric acid, DCP - MCP . When this solution interact with the soil it dissolves lime, aluminum, iron and manganese compounds that are immediately formed in the soil next to the fertilizer granule. In the low pH range - metal phosphates, aluminum, iron and manganese ( Fig. 2.18) are formed while a little further away, where the acidity declines , Calcium phosphates precipitates.
Superphosphate is simply an excellent fertilizer, containing (and also attracting) many other
nutrients apart from the phosphorous: calcium, sulfate, and a cocktail of micro nutrients.
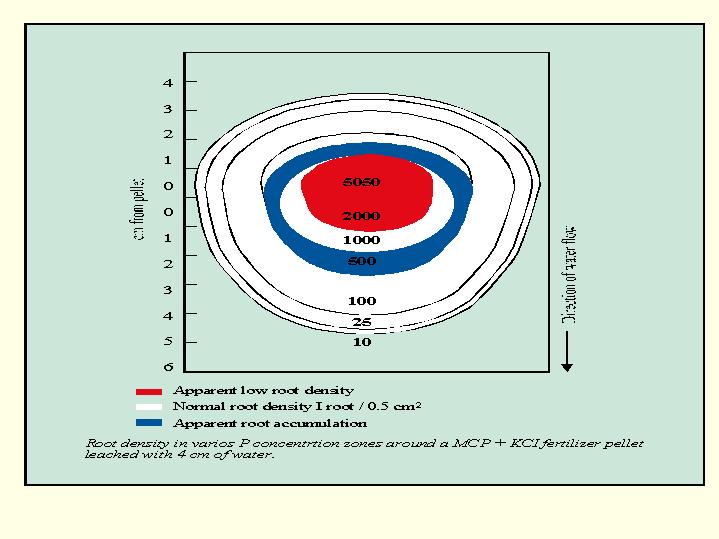
When the concentration of phosphorous is tested at various distances from fertilizer tablets containing superphosphate + KCI introduced into the soil there is a concentric decrease in the concentration as it gets further from the granule. The maximal density of roots is found at P concentration of 500 ppm ( 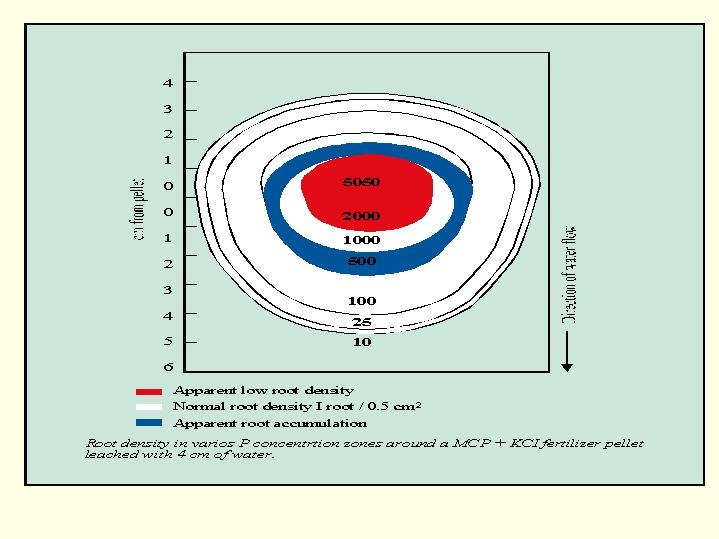 Fig. 2.19). Accordingly, when phosphorous is placed in the soil an increased root density is developed around it.
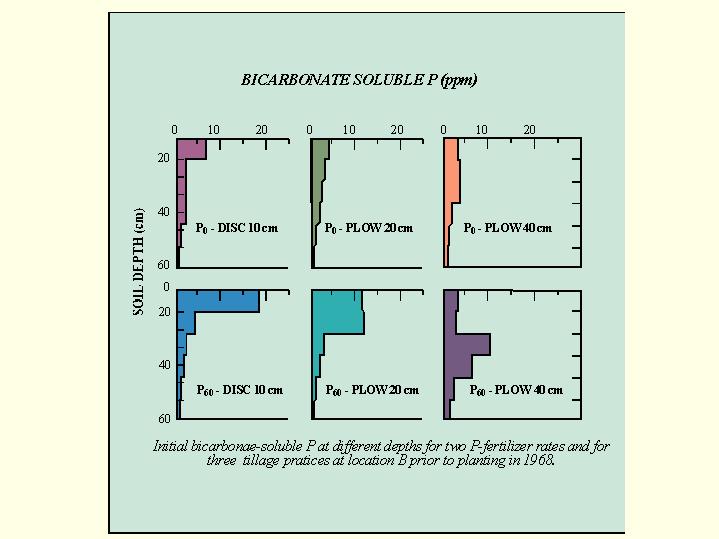
Kafkafi and Stibbe (1973 ) published results of work in Lachish land and Nachal Oz sails ( Fig. 2.20). In this work the phosphorous fertilizer was incorporated in the soil in 3 ways: Disc to a depth of 10 cm, ploughing to 20 cm, and deep ploughing to 40 cm. Wheat responded best to disc and cotton to ploughing. The explanation is two-fold: in winter, when the wheat grew, the soil temperature was suitable for its roots in the upper level and the main root system of the wheat is shallow. On the other hand, cotton grew when the surface area was dry for most of the time there fore cotton roots were able to take more P from deep soil layers than from surface applied while wheat behaved the opposite.. The small wheat root progress at a rate of 0.5 cm/day. It will not benefit from phosphorous hidden deep down before about 20 days after germination and by that time plant growth was hindered When phosphorous is mixed with the upper layer the emerging root can take it up immediately.
All crops with small seeds do not have a sufficient supply of phosphorous to support the plant for a long time. For such seeds it is necessary to place P near the seed. The roots respond to the concentration of phosphorous and when there is water and phosphorous - they grow, divide and lengthen. Under saline conditions root elongation is retarded and therefore encounters less P in a unit of time. Therefore under soil saline conditions increasing soil P concentrations to higher levels than are found in non saline soils can prevent P deficiencies.
In fruit trees, most of the flowers shed by the time the fruit ripens. The P nutrition of the trees affects this rate. An experiment with apples with phosphate fertilizer - (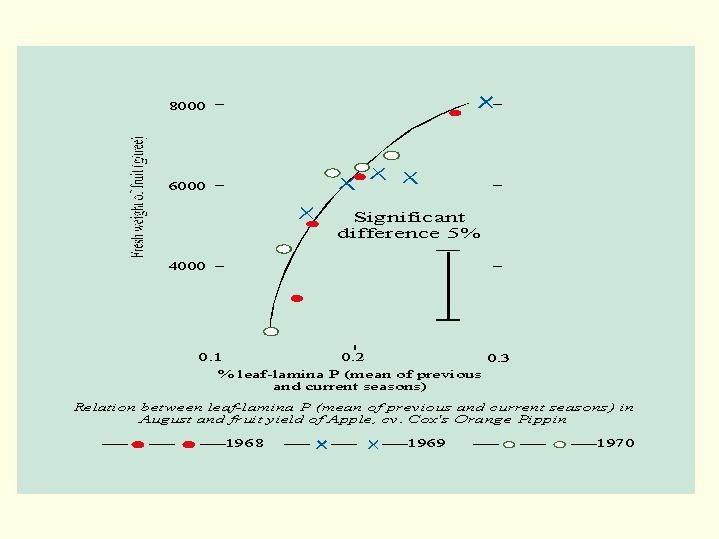 Fig. 2.21) shows that phosphate fertilization in a previous year increased the crop the following year. The fruits and especially the seeds are a sink for phosphorous. It can mobilize the P from the leaves and branches leaving the tree with little phosphorous reserves. Therefore blooming in the following year is adversely affected when phosphorous is missing. Restoring the tree with P fertilizer after fruit harvest is expected to restore P levels in the roots, stem and branches and by that to ensure next season fruit bearing.