Movement of Calcium and Potassium to the Developing Fruit and their Agricultural Importance
The distribution of nutrition elements is shown for the tomato in  Fig. 6.01. The total content of each nutrient element is assigned the value of 100% and it's fraction in the main plant parts: stem, petioles, leaf blades, and fruit is demonstrated in the column for each element.
Calcium deserve a special attention. The amount of calcium in the tomato fruit is about 2% only of all the Ca in the plant where most of it is accumulated in the leaf blades. This behavior of Ca is unique of all the elements (except for silicon which is almost totally absent from the fruit). About 70% of all the phosphorous in the plant is found in the ripen fruit, particularly in the seeds, and 65% of the nitrogen and more than 50% of the potassium of the aboveground organs accumulate in the fruit of the tomato. There is therefore a difference in the distribution of the elements between the various plants organs.
Silicon and in particular calcium accumulate mainly in the blade - at the end of the water transport system. High calcium concentrations are stored throughout the transport system. Ca create precipitates of mainly Ca-oxalate in the cells vacuoles . The silicone constitute the stem hairs, and of the leaf hairs of the tomato, of the wheat husks, the margins of the leaf of maize and the leaf blade of rice and other plants of the Graminae. These two elements move only in upward direction in the xylem and do not move back in the phloem.
 We can observe the calcium presence in the plant through a reflection of its presence in an auto-radiogram Fig. 6.02 . The calcium is found in the transport system and in the cell walls. When there are no disturbances in the supply of calcium - it also accumulate in the cell vacuoles the leaf blades. When there is a shortage in calcium uptake - it is first of all accumulate in the cell walls of the transport system (Fig. 6.02).
Let us examine the results of growing tomatoes under varying calcium nutrition conditions (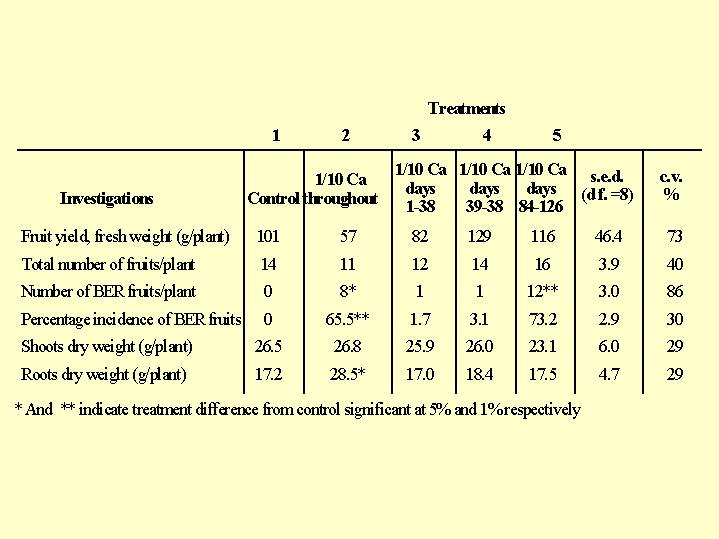 Fig. 6.03). When calcium is supplied throughout the entire growing period, there were 14 fruits per plant and "Blossom end Rot (BER)" did not appear. When the calcium concentration in the nutrient solution throughout the growing period was very low - the top was not affected, but the plant produced few fruits and 2/3 of them suffered from BER. When the calcium concentration was reduced to 1/10 of it's concentration in the full nutrient solution in the 1-38 days of growth there was little adverse effect on the fruit. A shortage of calcium in days 84-126, in which the fruit develops, caused a plague of BER. The conclusion from this study is that an early uptake and storage of calcium in the plant does not compensate for a Ca shortage in the nutrient solution, during fruit development as there is no translocation of calcium from rich tissues to new developing ones.
 A series of graphs ( Fig 6.04), describes the external influence of saline solutions on fruit growth shows that during the first 3 weeks of fruit growth the accumulation of all the dry matter was not greatly influenced by the increase in salinity but the rate of increase in fruit volume decreased, as the amount of water entering the fruit was greatly reduced with the increase in the nutrient solution salinity (
Fig 6.04 C).
In another series of curves (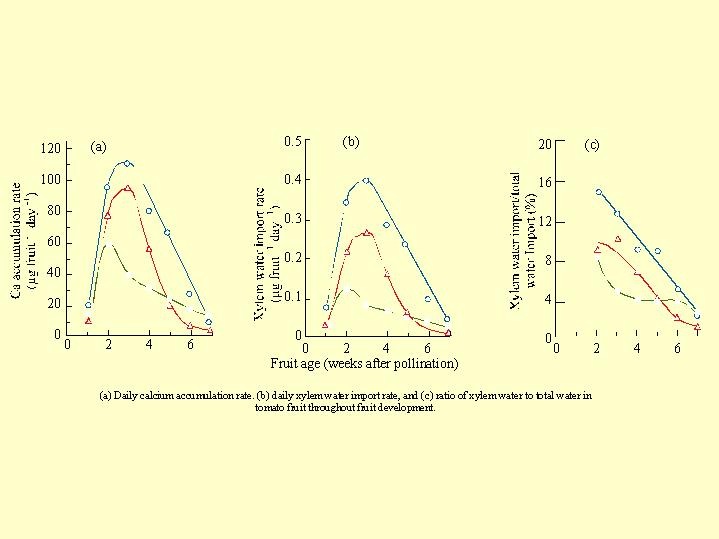 Fig 6.05) the following are presented: The daily rate of calcium accumulation in the tomato fruit (a), the daily transport of water to the fruit by the xylem (b), and the ratio between the xylem water to all the water in the tomato fruit (c). Curves (a) and (b) are similar in principle. As the salinity increases the amount of calcium reaching the fruit decreases. The curves in section (Fig 6.05 c) show that with time, and as the fruit develop, the rate of xylem water reaching the fruit reduces steadily.
This study can explain the increasing frequency of BER, with the increase in salinity and its extreme worsening when ammonium nutrition and salinity are combined. It is enough to reduce Ca uptake during the period of fruit early development to create a local Ca deficiency that could not be corrected by later supply.
The calcium reaches the fruit only through the xylem flow due to the root pressure.
The water flow in the transpiration transport Ca to the leaves but it does not move in the phloem back from the leaves to the fruit. If calcium does not reach the cell during cell wall elongation, the wall hardens with Ca deficient in the middle lamella. This will create irreparable damage of the cell wall that will develop to BER later in the season.  The fruit grows mainly at night when water enters to it under root pressure. The carbohydrates stored in the leaves during the day flow as sugars to the fruit at night. Anything that adversely affects the root pressure at night (salinity, root disease, extreme root temperatures, lack of oxygen) will result in fruit damage. Extreme changes form high salinity during the day to low salinity at night may cause the fruit burst. This happens as a result of irrigation with good water at night.
A schematic illustration (Fig. 6.06) of the distribution of calcium (a) in plant at day and night , and the flow of the phloem and the xylem by day and night (b) 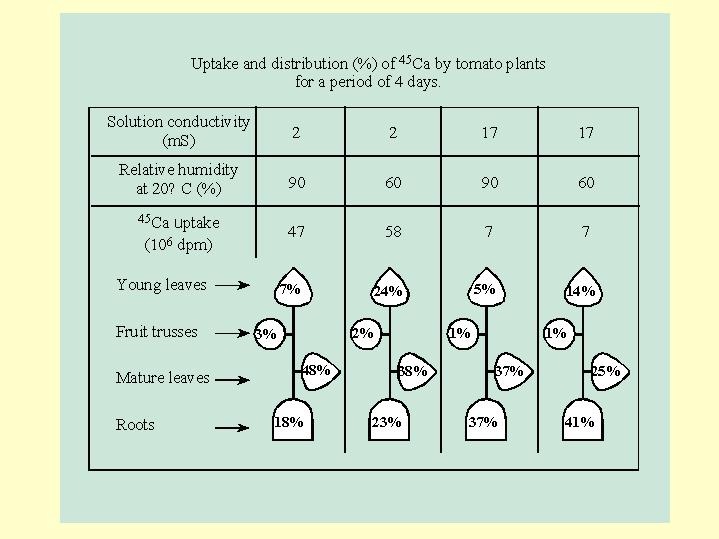 presents the relative strength of the transpiration flow and the quantity of calcium arriving with it. At night the movement of calcium to the leaves is less and its movement to the fruit is increased.
During the day the flow in the xylem is much greater than the xylem flow to the fruit (Fig. 6.07, Fig. 6.08). When there is relatively high humidity in the air during the day and/or a lack of water in the root zone at night - the xylem flow is adversely affected and with it the supply of calcium to the fruit . As a result increase in BER. The above description of Ca transport was taken from the detailed work of Ho (1991) as presented in Fig. 6.07 and  Fig. 6.08
As the fruit load on the plant increases, the amount of sugars supplied to the roots declines. The developing fruits are much stronger sink for sugar than are the roots. As a result, root growth is reduced, and so is the root pressure. This reduces calcium flow to the fruit at night and leads to an increased tendency to BER.
The growth of tomatoes in nutrient solution tested the influence of forced aeration of the solution during day and night, night only or day only (table in  Fig. 6.09).
Forced aeration at night prevented BER, but not forced aeration during the day. The reason is clear - forced aeration supplied enough oxygen and the root pressure was maintained at night, thereby increasing the supply of calcium to the growing fruit.
The interference with cell growth in the fruit and their cell wall stabilization, as a result of calcium shortage, may stem from many environmental causes. Their common denominator being interference with calcium uptake and its transport in xylem flow under root pressure. The difference in sensitivity to BER among plant species is explained by the differences in the anatomical structure of the xylem in the fruit and the density of the xylem network system in the fruit.
In potatoes, the bulb receives almost all its water through the phloem. The calcium does not move in the phloem and therefore the tuber must obtain calcium directly from its environment through its external skin. If part of the tuber surface does not come into good contact with soil water (because of clods or improper irrigation) there will develop local necrotic regions in the tuber skin.
Groundnut pods also receive calcium directly from the soil solution and the lack of it leads to defects in the skin. Gypsum can be a good supplier of calcium, as its solubility is limited so that there is no excess of salt concentration which could disturb the roots growth and the penetrating gynophor. Although most of soils and the irrigation water in Israel contain enough calcium, there are few cases were calcium deficiency was observed particularly in fruits. The reason for this is definitely related to irrigation problems. Excess water may cause a lack of oxygen and as a result decrease in the root pressure. Late water application or the use of saline water may also induce problems in Ca uptake and translocation. In soilless culture in glass houses aeration and high ammonium concentrations in the nutrient solution might be the main factors in Ca deficiencies found in fruits.
Potatoes
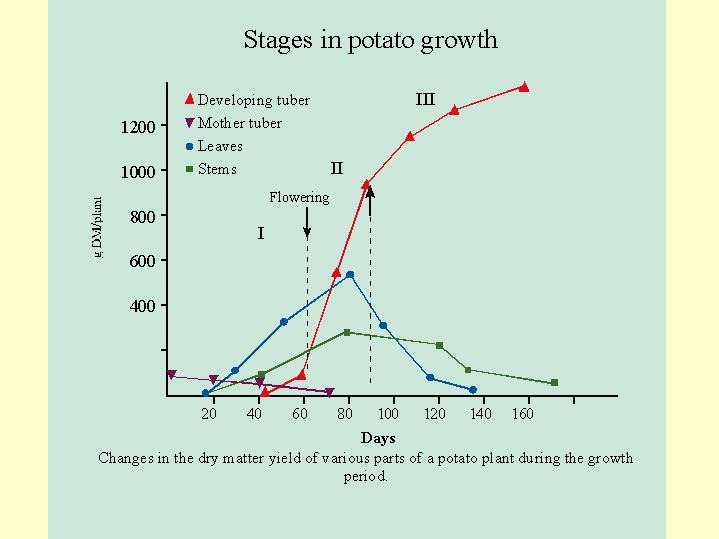
Potatoes stems develop from the mother tuber and quickly utilize its nutrient reserves. The rapid vegetative growth continues until the end of the flowering ( Fig. 6.10). Approximately with the flowering the carbohydrates are channeled and removed from the rapid growth to the storage organ, the tuber. The tubers are the commercial organ and the collected yield .
The rate of carbon, K Mg and Ca accumulation in the tuber can be seen in the pair of drawings from a Dutch work ( Fig. 6.11).
There is a direct relationship between the quantity of K reaching the tubers and their dry weight: The K concentration of the dry weight is 1.96% . This is required threshold for maintaining a proper yield of tubers.
At the same time the mother tuber is emptied of carbohydrates and potassium, and , since calcium does not leave the old tissues the concentration of calcium in the old tuber increases as its dry weight decreases.
Marschner and Krauss grew potatoes in various nitrate concentrations. The nitrate uptake was therefore relative to its concentration in the solution. The tubers stopped growing when the nitrate concentration was 7 meq/L , (about 100 g N/m3 ). The reason is not clear. High nitrate concentration encouraged vegetative growth. A high concentration of nitrogen delay tuber initiation. (table in Fig. 6.12b  Fig. 6.12a).
The competition on carbohydrate consumption between the top and the underground storage organs is in favor of the leaves at high N levels in the root zone. Nitrogen fertilization at the stage of the tuber filling must be taken with caution since it is a very delicate balance between active foliage that must be maintained to keep producing carbohydrates and tuber growth. Excessive N fertilization can lead to high production of foliage on the expense of tubers.
Moorby (1968) reported the influence of hand pruning and cutting the tops of the growth and initiation of potato tubers (  Fig. 6.12 b) . It appears that cutting the top is effective in increasing the dry matter tuber yield. Removing the growing tips, which are a source of giberrelin that stimulate top growth directed more carbohydrates to the tubers.
Two key elements in getting high tuber yield are therefore: 1- control of the nitrogen nutrition level (organic manure, for example is hard to control N level in the soil) and 2- preserving the leaves integrity and their proper activity in order to keep supplying the tuber with carbohydrate. To do that the plant must have enough reserves of K and P so that the developing tuber will not withdraw these elements from the leaves in favor of the tuber.
We shall cite a work on potatoes, which describes The response of potato to high doses of N were studied by the late Amos Feigin in Gilat experimental farm on a loess soil. He used up to 30 kg N/d in 1974 and 1977 (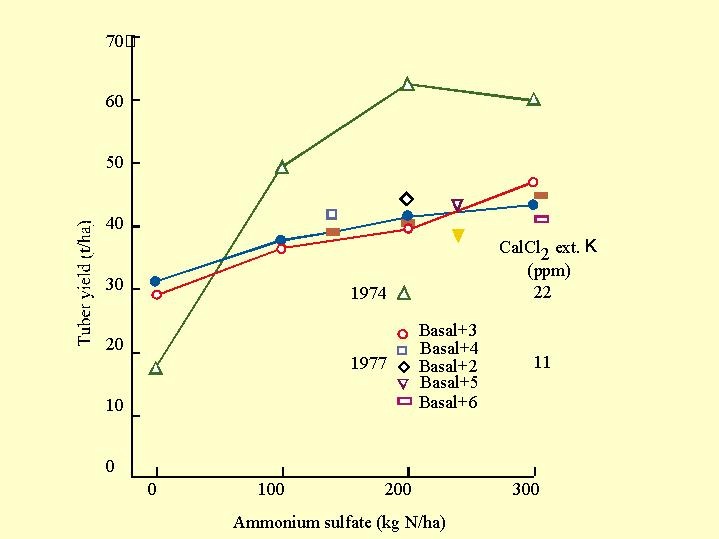 Fig. 6.13). The response to N was very different between these years. In the year in which the potatoes were sown immediately after the harvest of wheat for silage there was hardly any response to the addition of nitrogen , Testing the plant mineral content suggested that potassium shortage was responsible for that lack of response..
In the other year, after celery crop, in which the soil stood idle for several months before the potatoes were sown, the exchangeable potassium in the soil was twice as much as after wheat for silage and the potassium in the tuber was almost doubled. When high K was available the potato responded strongly to nitrogen applications up to 200 kg N/ha.
 In that work (under circumstances that differed from the Dutch work above) a concentration of 2.2 - 2.3% K of the dry material was found in the tubers, when there was hardly any response to nitrogen fertilization. In the year in which the crop responded to N application the potassium concentration in the tubers was 3.8 - 4.0%.
The developing tuber also mobilize the phosphorous from the leaves to a level the leaf stop to function . In the experiments of Ami Gibbs, 1997, in the framework of his M.Sc. thesis, it was found that spraying the foliage with mono potassium phosphate (MKP) extended the leaf activity and increased tuber yield.
 Spraying with other K fertilizers did show any effect. It is therefore the phosphate that is needed to keep on carbohydrate production in the leaves.
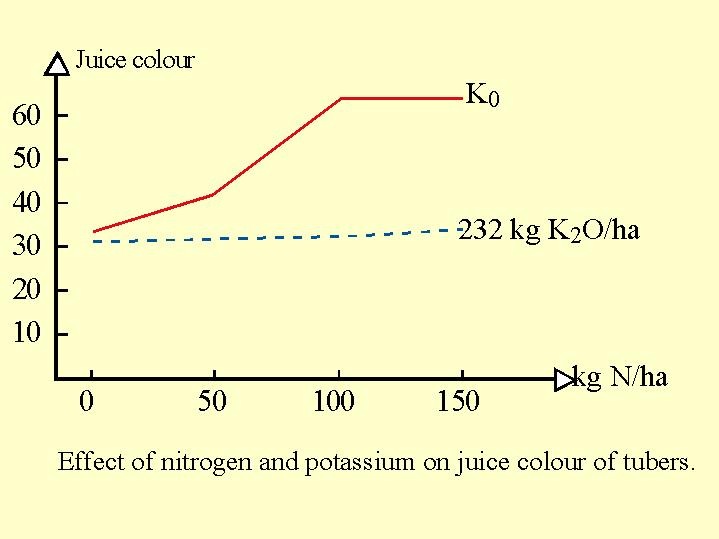
The concentration of potassium in the tuber is crucial. It has many implications on the commercial value and quality of the tubers ( Fig. 6.14b Fig. 6.14a ). Juice color: - at low levels of potassium, the addition of nitrogen leads to an increasing blackening of the tuber juice.
 At high potassium levels no juice blackening is observed with the addition of nitrogen.
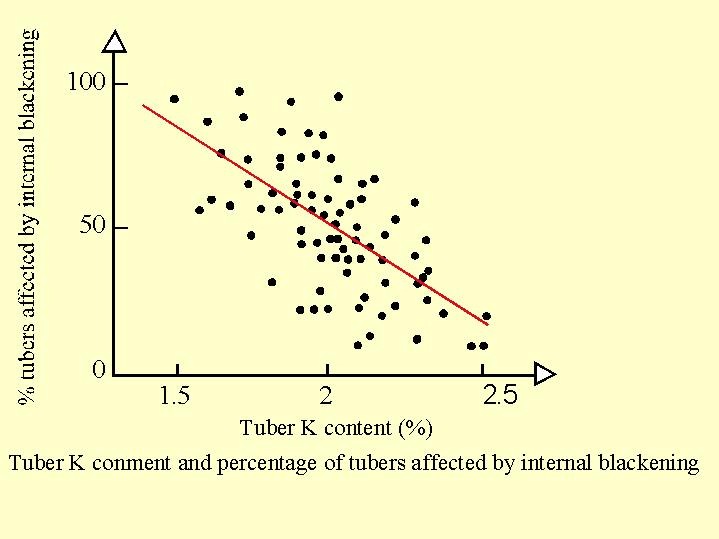
Internal blackening (Fig. 6.15a ): There are many instances of internal blackening of tubers. Increasing K fertilization and the potassium content in the tuber reduced the internal blackening. Above 2% potassium of the dry matter was required to reduce the phenomenon to a tolerable level .
 At very high levels of K application (Table in Fig. 6.15 ) KCl is more effective than K2SO4 in reducing internal blackening.
Application of potassium fertilizers. It appears that in most soil types the entire potassium dose can be given as basal dressing. In sandy land addition of potassium can be given with the irrigation together with nitrogen fertilizer.
In a potato experiment at Merom Hagolan in 1975 (Fig. 6.16) the control plots, without the addition of nitrogen, produced about 650 kg/d tubers (dry matter). 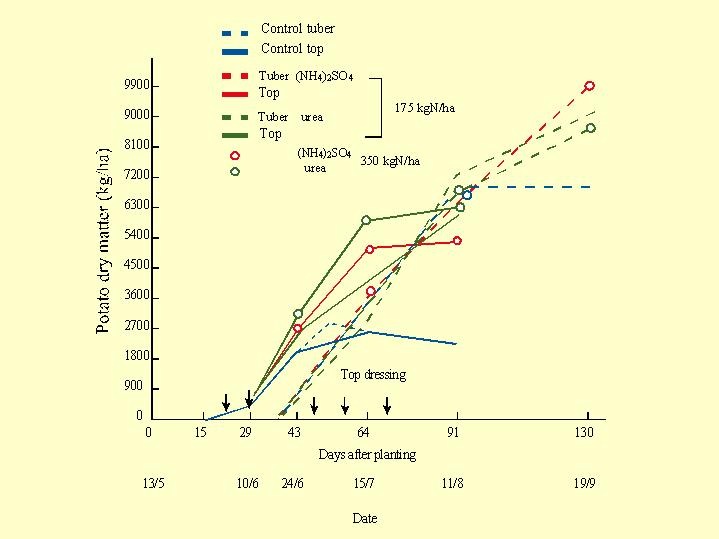 The other treatments compared application of the whole amount in one dose or split the N applications into 5 with cumulative amount of 17.5 or to 35 kg N/d as urea or in the form of ammonium sulfate.
The large nitrogen dose reduced the rate of tuber growth and postponed the date of tuberisation by about 2 weeks ( Fig. 6.17). The amount of nitrogen in the plant has a great influence on the carbohydrate destination and the preference between tuber or top. The control nitrogen level in the soil solution is the farmer's main effective tool to control and direct the activity of the plant to it target yield ( Fig. 6.17).
SOIL POTASSIUM
Most of the K fertilization studies in Israel have been done in the past with annual cereals, which hardly show any yield response to K fertilization. This perhaps explains why there is an insufficient appreciation in Israel until recently to the importance of potassium fertilization.
The sorption of K on the three main types of clay minerals varies with the mineral.
The principle difference between Montmorillonite clay and Ilite is that the isomorphic exchange in Ilite is in the tetrahedron layer, which differs from the isomorphic exchange in the octahedrons in the Montmorillonite. It follows that the layer of negative charge in the Ilite is closer to the surface of the mineral and the bond with the potassium is stronger.
Potassium traps and closes the layers of the Ilite clay particles (as does ammonium) as it's size fit exactly to the hexagonal space between the oxygen atoms of the tetrahedrons on the mineral layers. In the ilite mineral the potassium constitutes 6% of it's weight.
A comparison of the content of the potassium in soil with the same clay percentages but with various types of clay, shows that the quantity of the exchangeable potassium (in meq/100 gram) is fairly similar. The total K the content of the plough layer (40 cm) in the case only 10% of Ilite is present out of the total 50% total clay in the soil is 1500 kg potassium per dunam (15 t K/ha ) as opposed to less than 100 kg K in all the Montmorillonite fraction in the same soil layer.
The ratio between sorbed potassium and sorbed calcium (in units of meq/100 g soil) - is expressed in the Gapon equation (KG is termed the Gapon constant).
The KG is the constant in the equation expressing the ratio between the potassium to calcium adsorbed (ads) in the exchangeable site to their ration in the soil solution (sol) ( Equation ).
The radius of the ammonium ion is closer to that of potassium than all other cations. Plants are able to extract quite easily the fraction of exchangeable K. The rate of release of the "fixed" K from it's sites inside the clay particles is too slow to satisfy plants demands. However, the "fixed" K is a source for replenishment of exchangeable potassium on the clay surface area.
Sela Feigenbaum grew cereals in a small volume of various soils. The potassium uptake did not depend on the % of the exchange potassium but on the total amount of exchangeable potassium. Accordingly the clay soil of Nir David, with a relatively low % of exchangeable potassium, produced a higher K yield than Ze'elim sandy soil in which the exchangeable potassium percentage was high, but the total cation exchanged capacity was low.
The Woodruff equation and the expression of potassium availability in _F uses the ratio between K and the sum of Ca and Mg in the soil solution to estimate their ratio on the soil particles.
Using the equations as presented in 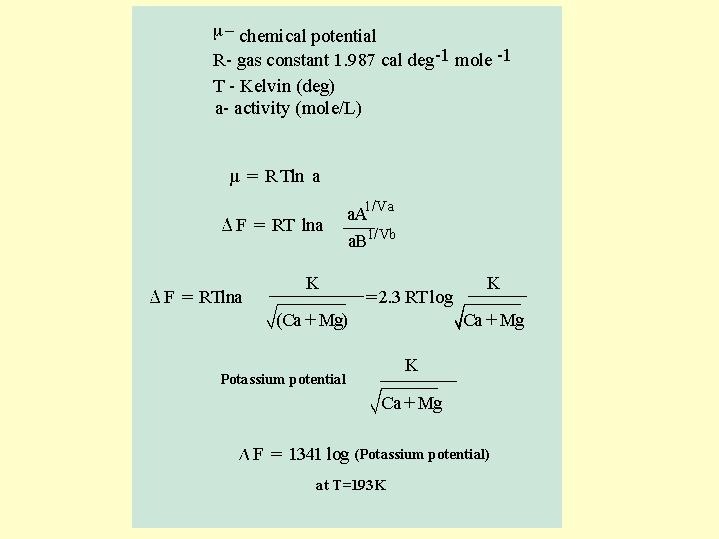 Fig. 6.19 the "free energy" of K exchange with Ca and Mg was calculated.
The _F value represents the energy needed to release K from its adsorbing site and there fore it was expected to correlate with chances to observe plant response to the potassium. This was not proven to be any better estimation of available K than any previously used methods that analyzed the potassium exchangeable in the soil. The ratio between K and Ca on the soil surface is not as important as the absolute quantity of potassium per unit soil weight or volume. It is also misleading to think that when there is a great deal of calcium in the soil the quantity of potassium in it is ineffective as it is implied from the Woodruf equation. Most agricultural systems throughout the world work according to quantitative tests of extraction of exchangeable potassium, soluble or soluble + exchangeable.
Calcium chloride extraction replace some fraction of the exchangeable K. There is a good correlation between K extracted by 0.01 M CaCl2 solution with that of the world over used method of 1 M ammonium Acetate solution. We found that extraction by 0.01 M CaCl2 solution extract about 1/3 of the K extracted by 1 M ammonium Acetate solution. However CaCl2 solution is cheaper and allow easy work with the flame photometer.
The best way to estimate K availability for plants is to calculate the exchangeable quantity of potassium in the soil layer utilized (or in the volume utilized) by the plant, compare it with known values of total maximum K needed by the crop at peak demand period. To ensure that K will suffice to maintain crop growth about excessive amount by 20 % of the total K demand is needed to maintain in the soil in exchangeable form.
The results of many experiments show that the response of plants to potassium is linear to a particular level, whether of exchangeable potassium or soluble potassium in the soil.